solarized light
Final Project
In this project we will visualize the warp breaks dataset. The warp breaks dataset contains weaving data from 1950 on the number of breaks in warp (a set of yarn vertically wrapped around a loom). There are measurements for looms consisting of data on three variables: the number of breaks, the type of wool, and the type of tension.
Here is a look at the data set.
solarized light
If we look at the entire dataset, we see that wool and tension are string variables which contain possible values of:
- Wool: A, or B
- Tension: L, M, or H
The goal of this data science exercise is to visualize the difference in the number of breaks by loom and by groupings of wool and tension.
Step 1: Add loom numbers
As we can see from the data there is a pretty important variable missing, a loom identifier! Since it will be a useful variable to have, let us suppose the data observations are ordered such that the first observation for each group is loom 1, the second loom 2, and so on.
Let's add this loom identifier to the warp breaks dataset as a
column called loom using group_by and
mutate. The values should go 1 through 9 for AL,
then 1 through 9 for AM and so on. There are a couple ways to do this:
grouping on wool and tension; another way to add these values
is by using a for loop that repeats a count every nine steps.
Feel free to use whichever way you prefer.
solarized light
Great, we did it! The first 5 rows of the warp breaks data set should look like this now:
| breaks | wool | tension | loom |
|---|---|---|---|
| 26 | A | L | 1 |
| 30 | A | L | 2 |
| 54 | A | L | 3 |
| 25 | A | L | 4 |
| 70 | A | L | 5 |
Step 2: Combine wool and tension into one grouping variable
In this dataset there are two grouping variables: wool and tension. Since we would like to look at the distinction across both wool and tension at the same time, we will need to do one of two things, either group by both as we did in the previous step or create a new variable that uniquely identifies each group combination.
In preparation of adding colour to the figure in the next step, we will want to combine these two variables into one.
Let's use the paste0 function to combine the string
values in wool and tension into one variable called wool_tension.
solarized light
Our updated table with wool_tension should look like this now:
| breaks | wool | tension | loom | wool_tension |
|---|---|---|---|---|
| 26 | A | L | 1 | AL |
| 30 | A | L | 2 | AL |
| 54 | A | L | 3 | AL |
| 25 | A | L | 4 | AL |
| 70 | A | L | 5 | AL |
Step 3: Plot breaks for each loom
We have everything we need to visualize the data. Let's put loom on the x-axis, breaks on the y-axis, and add wool_tension as a grouping variable, we will need to include the answers from the previous two steps to update the warp breaks dataset.
solarized light

This graph should look like the following:
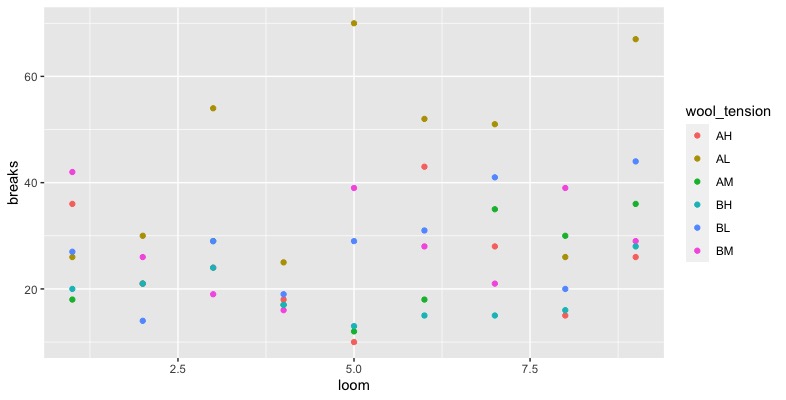
Okay, this graph is nice. It shows the breaks for each loom and has colour to identify groups. We see the gold colour group, AL has a higher number of breaks than the other groups. Let's aggregate the data by calculating the mean for each group and visualizing this once more with a bar graph.
Step 4: Calculate means
In this step let's use group_by and summarise
to calculate the mean number of breaks in each group.
solarized light
This table summary should look like this:
| wool_tension | breaks |
|---|---|
| AH | 24.55556 |
| AL | 44.55556 |
| AM | 24 |
| BH | 18.77778 |
| BL | 28.22222 |
| BM | 28.77778 |
Step 5: Visualize with a bar graph
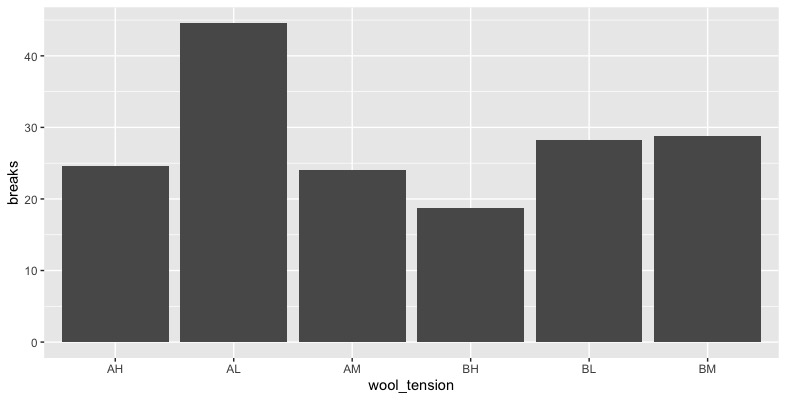
Now that the data is in a simpler and more compact form, let us use
geom_col to make a bar graph with the wool_tension
variable we made in step 2 on the x-axis and mean breaks we made in
step 4 on the y-axis.
solarized light
Our graph should look like this:
Step 6: Improve the graph
This graph gets the message across. We definitely see that the AL group has more breaks than other groups, but this graph can be improved with a clearer axis names and colour!
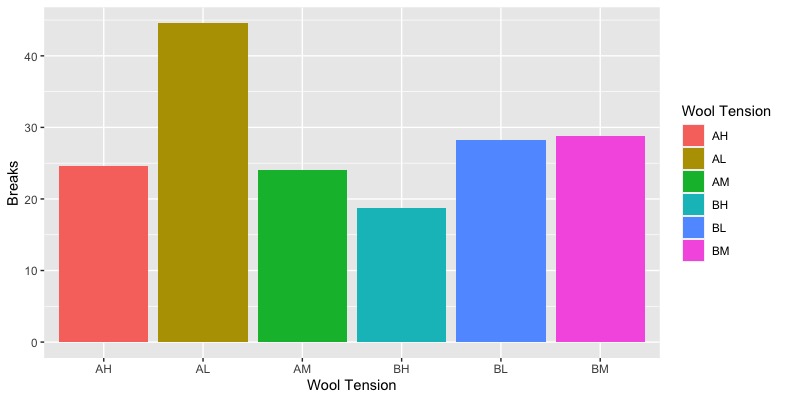
Let's add colour by adding fill on the grouping variable
in the aesthetic and add labs after
geom_col to adjust the axis names.
solarized light
Our final graph should look like this!
Very well done! You have officially completed the main content of this course! Feel free to continue to the next two lessons where we will go over what comes next in your programming journey.